http://EVAoSD.FarTooMuch.Info/forsale.htm is this page's URL.
Simulation of an Electric Vehicle
Part 2 - Torque
(Available Torque vs. Needed Torque)
by J. Russell Lemon
March 2003 with February 2008 update
EV Spread sheet
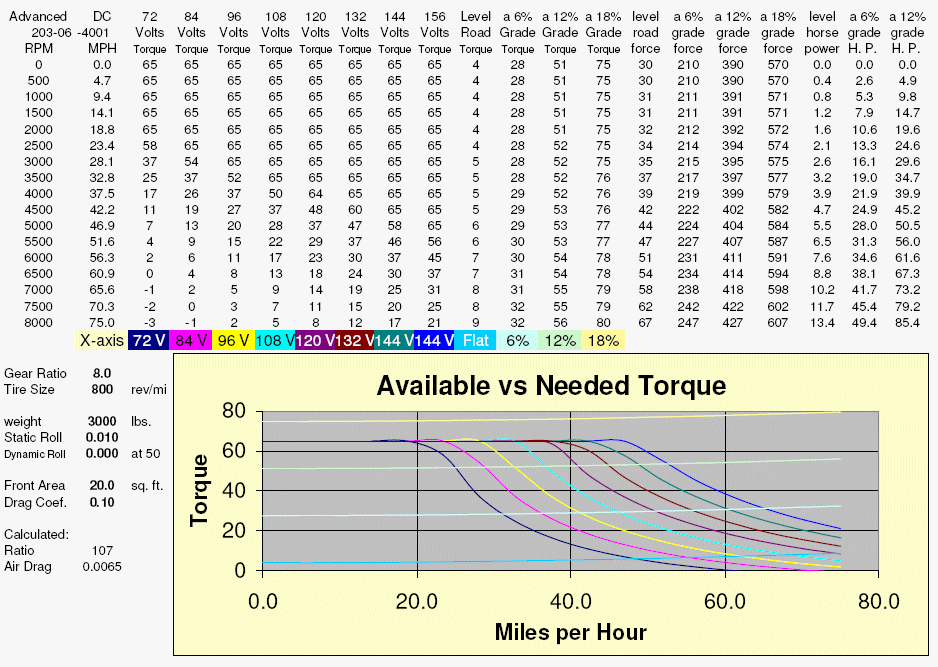
In order to evaluate the various trade-offs of vehicle size, weight, number and type of batteries, motors, etc., an Excel spreadsheet was programmed with variables as parameters to be entered. Note that the torque is limited to the motors maximum continuous torque. A first approximation results in the following simulation spreadsheet:

For this simulation, an Advanced DC 203-06-4001 was selected as the motor. From speed-torque curves, a set of equations was developed to model the motor. These equations were entered into the spreadsheet. Overall gear ratio and tire size were left as variables. These parameters fix the relationship between motor RPM and speed in MPH. They also fix the relationship between motor torque and the horizontal force [thrust] on the vehicle. This is the force that overcomes frictional losses and accelerates the vehicle.
The vehicle size, weight and shape were also left as variables to be modified. The shape and size are entered as the frontal area and drag coefficient. The air resistance is proportional to frontal area, drag coefficient and the speed squared. In addition is the rolling resistance of the tires and bearing losses that has both a static component and a component that is proportional to vehicle speed. For example, for a given weight, radial tires have about half the rolling resistance as bias-ply tires. There are also special low rolling resistance tires that have even a lower rolling resistance for a given weight than common radial ply tires.
Weight is a significant problem when going up hills or accelerating. Both require large amounts of power. The force needed to push a vehicle up a maximum freeway grade of 6% is the same as an acceleration of about 1.3 mph/second, is equal to 6% of the weight of the vehicle. The force needed to push a vehicle up a 20% grade is the same as an acceleration of about 4.4 mph and is equal to 20% of the weight of the vehicle.
This spreadsheet show the torque required as a function of speed [in MPH] for a level road, and for grades of 6% and 12%. The 6% grade is the same as 1.3 mph/sec acceleration on a level road. Note the significant horsepower requirements shown in the table.
The weight of the vehicle is the sum of the weight of the car itself, plus the weight of the batteries, motor, controller, driver, passengers and whatever luggage they are transporting. The weight of the motor is about 107 lbs. But for the vehicle to have reasonable performance and range with lead-acid batteries, between a third and half of the vehicle weight must be in the batteries. Even so, typical range is less than 100 miles for an aerodynamic vehicle designed for efficiency and minimum body weight. For a typical gasoline powered vehicles converted into an electric vehicle, a 50-mile range is not uncommon. By changing the gross weight in the spreadsheet, the effect of weight on performance is obvious. Battery selection is an important part of electric vehicle design. As can be seen on the spreadsheet, to get the power you need requires adequate voltage. Power is, of course, the product of voltage and current. But to be able to force the current through the motor at freeway speeds requires voltage as well as the ability of the batteries to be able to supply the current. Not having enough voltage is a common mistake in vehicle conversions. It should also be mentioned that no battery delivers full rated voltage when under heavy load. Batteries do have internal resistance. This must be taken into account during battery selection.
This spreadsheet shows available motor torque for battery voltages of 72, 84, 96, 108, 120, 132, and 144 volts. At high speed, motor torque is limited by battery voltage. At low speed, motor torque is a current limitation. Current may be limited by the battery, the controller and by the motor itself. In this spreadsheet, a 400 amp, 65 ft-lb limit was selected. According to motor charts, there is a 5 minute limit at 96 volts and 322 amps [47 ft-lb] due to heating effects. There is also a 1 hour limit at 96 volts and 190 amps [22 ft-lb] limit, and a continuous rating of 178 amps [17 ft-lb] or less. These current - torque ratings decrease with increasing voltage. These ratings assume a reasonable ambient temperature and an adequate flow of air through the motor. Often motors are installed with thermal sensors to connect to a driver warning light to indicate excessive heat, and to reduce motor power until the rotor cools off.
One would like to think that a battery has a fixed amount of energy [volt-amp-hrs] that can be used at any time. Unfortunately, this is not the case. If power is low, the battery voltage and the amp-hr rating can be a reasonable guide to energy stored in the battery. Indeed, the battery amp-hr rating is for a 20-hour steady discharge. But the high power demands of an electric vehicle cause much of the battery's energy to be lost both as heat and unavailable charge. Typically one third of the battery's energy is lost at a one-hour discharge rate. Even worse is the energy lost when hundreds of amps are needed to get up that freeway ramp and up to freeway speed. During this time, two units of energy can be lost. for every unit used.
The effects of age and temperature need also to be taken in consideration. As batteries age [become very old], their energy storage capability decreases. The range and maximum speed of the vehicle are diminished. Cold batteries also have difficulty delivering the necessary power.
Again, the purpose of setting up the spreadsheet is to be able to play with the parameters and see what happens. What happens when I change the gear ratio? What happens if I use 8-volt instead of 6-volt batteries? What happens when I put two more people in the car? I go to the spreadsheet and see what happens. I look at the difference between the available torque, and the torque needed to determine what acceleration is possible at each speed. It quickly become obvious that with electric vehicles, conservation of energy is much more important than with vehicles powered by fossil fuel.
The spreadsheet was programmed with typical tradeoffs between motor power, battery voltage, for a typical vehicle. A typical vehicle design weight of 3000 lb was chosen with a typical frontal area of 20 squre feet and average coefficient of drag of 0.5. Typical tires for a car this size revolve about 800 times per mile. With only one motor and a selection of gears, operation is possible. Operation with a gear ratio of 8:1 is shown. To get the needed speed, maximum battery voltage of 144 volts was selected. This requires eighteen 8-volt batteries, (twenty-four 6-volt battiers would have to much weight and 12-volt batteries cannot supply the required current.) The weight distribution would be 1000 lb for the car, 1200 lb for the batteries, 150 lb for the motor, 100 lb for the controller and wiring, leaving 550 lb for the passangers and cargo. [3000 lb gross weight]
Looking at the spreadsheet it can be seen that the top speed of almost 65 mph can be acheived on a level road, but with no reserve for accelleration. With a 6% grade, the speed would drop to about 53 mph. And to go up Laura Street, the gear ratio would have to be increased from 8:1 to 12:1 which would give a speed of about 30 mph. Marginal performance at best.
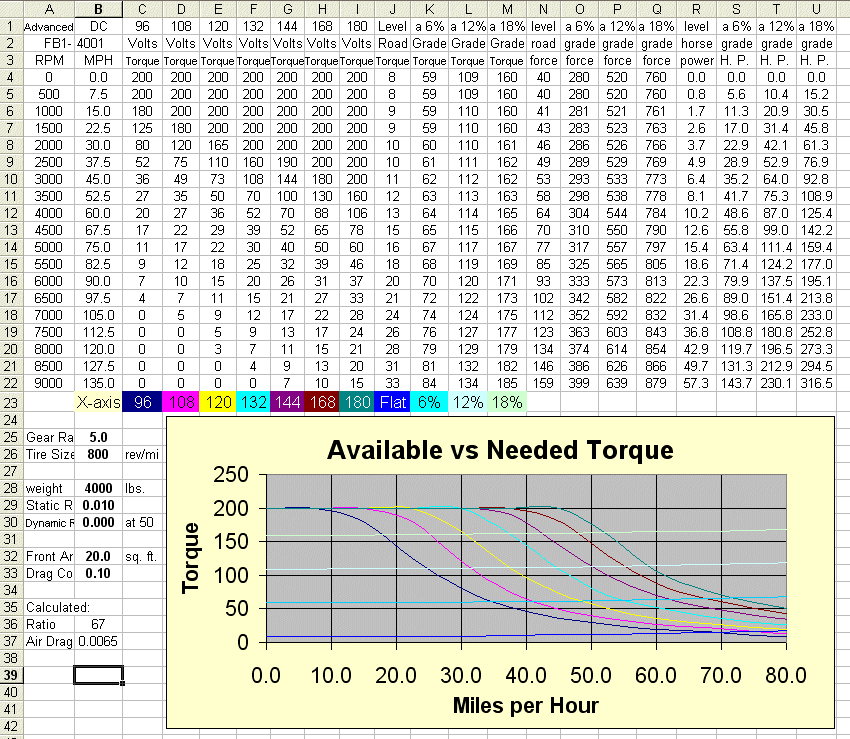
And here is a similiar spreadsheet for the larger Motor FB1. Again note that the motor curves are limited to the maximum continuous torque. Here the added benefit of the increased continuous torque is evident. Even though this vehicle is heavier because of the increased weight of the motor, and the larger set of batteries to provide the motor with the power to go the desired speed and the energy to go the desired distance.

Note that their may be errors in the graphs. If you find any, please let me know!
Also see :
EV Simulation Spreadsheet Part 1. and
EV Simulation Spreadsheet Part 3.